The CIBC AI Assistant is a machine learning and NLP-based system designed to analyze financial data and respond to user queries about CIBC’s quarterly reports. It combines automated data extraction, regression modeling, and a conversational chatbot interface.
The process begins by extracting structured data from CIBC’s quarterly reports spanning Q1 2023 to Q3 2024. After data cleaning and feature engineering—including extracting temporal features like quarter and year—the data is standardized and encoded to prepare it for machine learning models.
Several regression models were implemented, including Linear Regression, Random Forest, XGBoost, and a deep learning model. After hyperparameter tuning, XGBoost and the deep learning model showed the highest performance, achieving R² scores of up to 94% on the test set.
A financial chatbot was built using TF-IDF for text vectorization, Duckling and regex for entity recognition, BERT for intent classification, and DialoGPT for fallback responses. This chatbot was integrated into a web application using Flask, HTML, CSS, and JavaScript, enabling users to ask financial questions and receive real-time responses.
The CIBC AI Assistant demonstrates how AI can automate financial analysis, making it accessible through intelligent and interactive interfaces.
Data Extraction
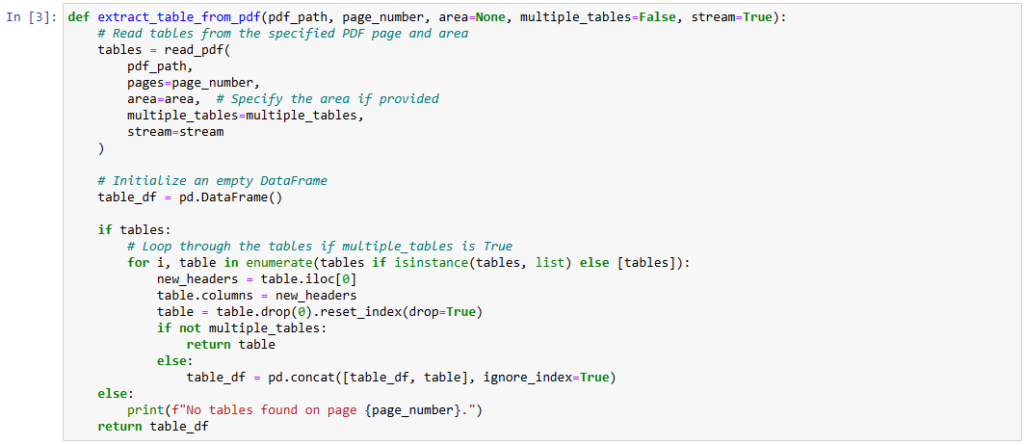
Data was extracted from CIBC’s quarterly financial reports (Q1 2023 to Q3 2024) in PDF format using the tabula-py library, a Python wrapper for Tabula, which is a powerful tool for reading tables from PDFs using Java. This allowed precise and flexible parsing of tables from individual pages and specified regions.
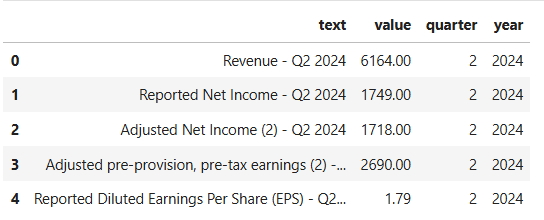
Tables were parsed page by page, and key financial metrics were extracted into structured data frames. These were then unpivoted into two primary columns:
text: Describes the financial metric (e.g., Revenue, Net Income)
value: The corresponding numerical figure
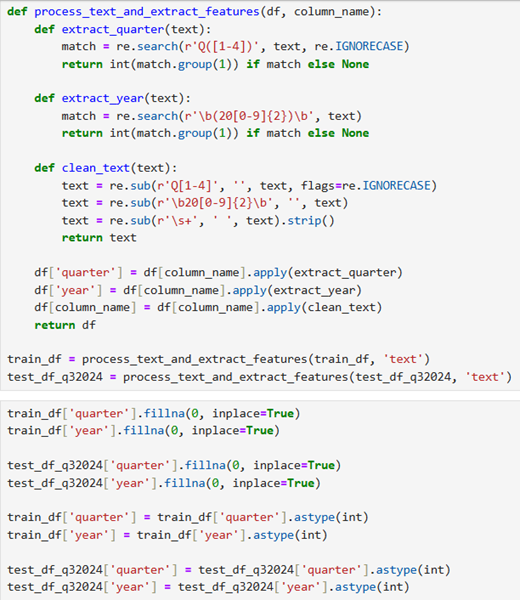
Regular expressions were used to extract temporal features, including quarter (e.g., Q3) and year (e.g., 2024), directly from the text column. These features provided time-based context critical for trend analysis and model performance.
Data Cleaning
Following extraction, the raw financial data required several preprocessing steps to ensure consistency, accuracy, and readiness for machine learning tasks.
The extracted data was initially unpivoted into two key columns – text, value
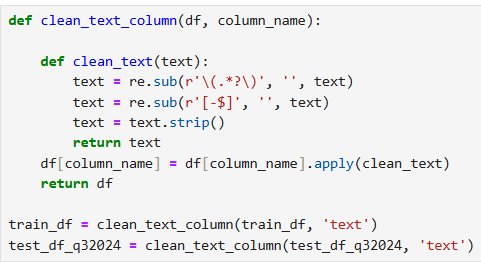
To prepare the text column for further analysis:
All entries were converted to lowercase
Special characters, symbols, and excess whitespace were removed
Consistent formatting was enforced across entries
These steps made textual data suitable for encoding and natural language processing tasks like intent recognition.
Using regular expressions, temporal information such as quarter and year was extracted from the text column and stored in new columns. This transformation enabled time-series analysis and enhanced model performance by adding temporal granularity.
Feature Engineering
Feature engineering focused on extracting meaningful temporal and textual features to improve model accuracy. Two new columns—quarter and year—were derived from the text column using regular expressions. These features introduced time-based context essential for modeling financial trends.
Additionally, the text column, which describes financial metrics, was encoded for use in machine learning models. Both Label Encoding and TF-IDF vectorization were applied at different stages to test their impact on model performance.
These engineered features enhanced the dataset’s structure and allowed models to capture patterns across time and financial categories more effectively.
Data Preprocessing
The preprocessed dataset was prepared for machine learning by standardizing and encoding key features. The value column was normalized using StandardScaler to ensure a mean of 0 and unit variance, making it compatible with regression models.
Categorical text data was encoded using LabelEncoder, and in later stages, TF-IDF was used for richer textual representation. The final dataset included text_encoded or TF-IDF vectors, along with quarter and year as numerical features.
The dataset was then split into training and testing sets (80/20) to evaluate model performance on unseen data.
Model Training
Three regression models were trained: Linear Regression, Random Forest, and XGBoost. Models were evaluated using R² scores on train, test, and validation sets.
Linear Regression underperformed due to its inability to model non-linear relationships.
Random Forest achieved strong training scores but showed signs of overfitting.
XGBoost delivered the best overall performance with an R² of 0.90 on the test set, demonstrating high accuracy and generalization.
These results guided the selection of XGBoost for further optimization and integration into the chatbot system.
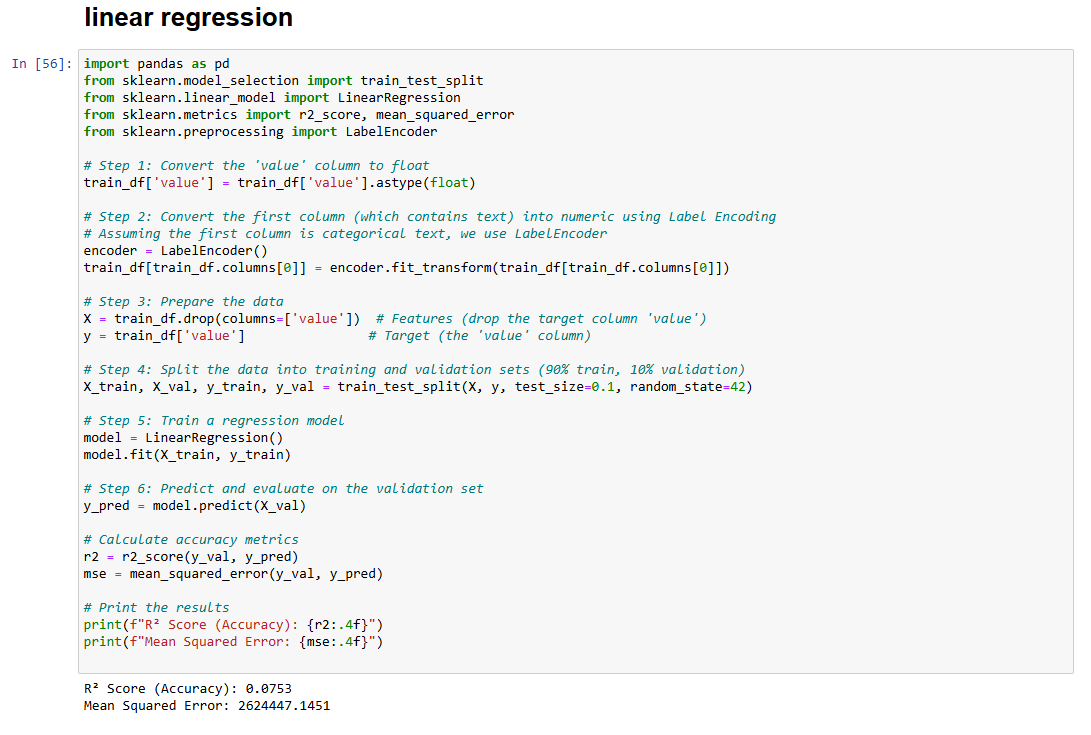
From the image you can see the performance of Linear Regression with a high Mean Squared Error – 2624447.1451, and very low R2 Score – 0.0753
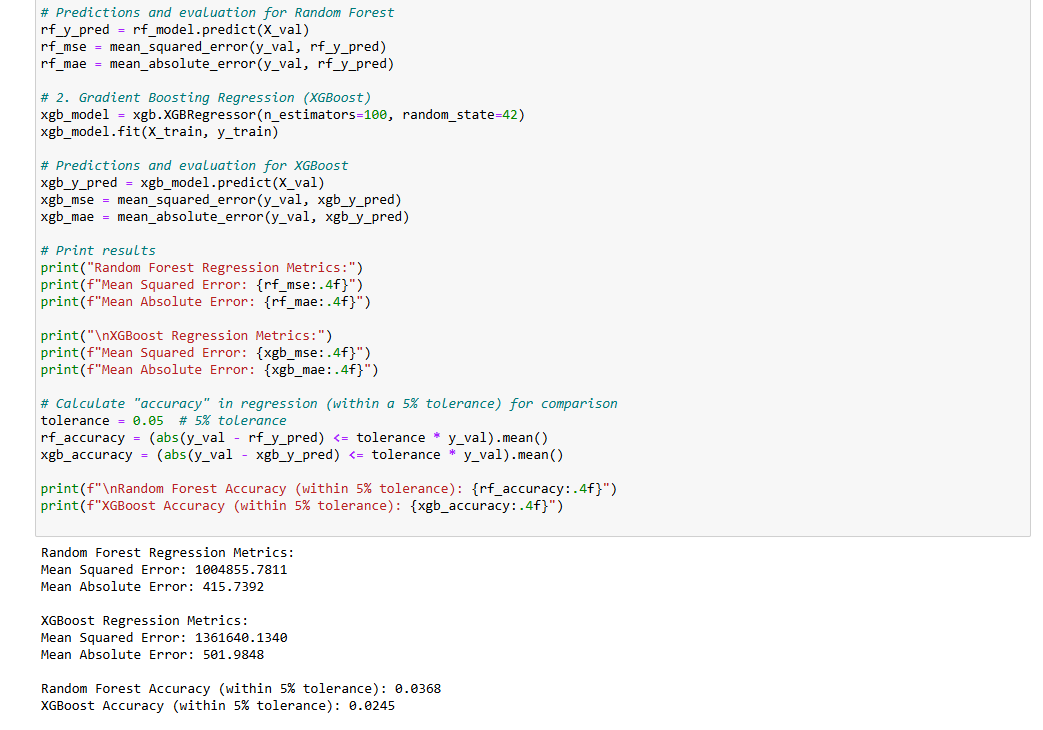
Although XGBoost showed better overall model scores, a closer look at error metrics told a different story. Random Forest had lower errors, with a mean squared error (MSE) of about 1,004,856 and a mean absolute error (MAE) of 415.74, while XGBoost had higher errors (MSE: 1,361,640, MAE: 501.98). When checking how often the models predicted values within a 5% margin of the actual number, accuracy was low for both—only 3.68% for Random Forest and 2.45% for XGBoost. This shows that while the models captured overall trends well, they struggled to make precise financial predictions.