This project aims to classify sections of CIBC’s quarterly financial reports into categories that can help analysts and stakeholders understand key financial aspects such as performance, risks, and forecasts. These reports contain dense and technical financial data, so NLP techniques are used to automate the classification process.
Additionally, a chatbot feature is integrated to enable user-friendly querying of the classified report sections, providing a more interactive and efficient way to access specific information.
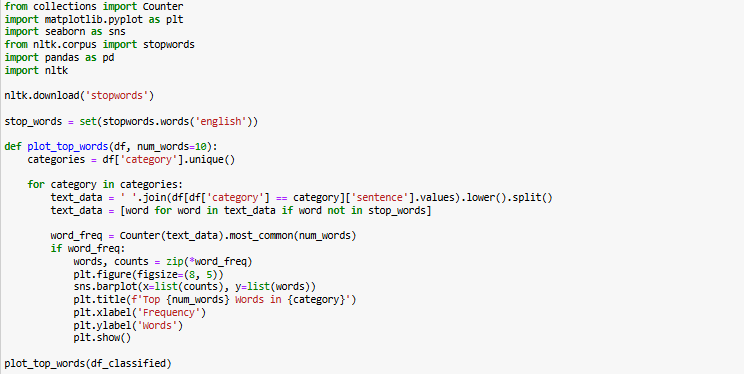
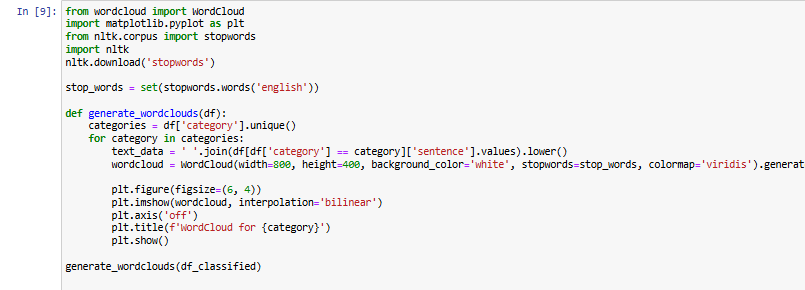
Importing Libraries
Data Extraction
Financial data was extracted from CIBC’s quarterly reports spanning Q1 2023 to Q3 2024. The extraction process involved parsing structured tables from these reports using Python libraries such as pdfplumber and pandas. Key financial metrics were identified and stored for further analysis.
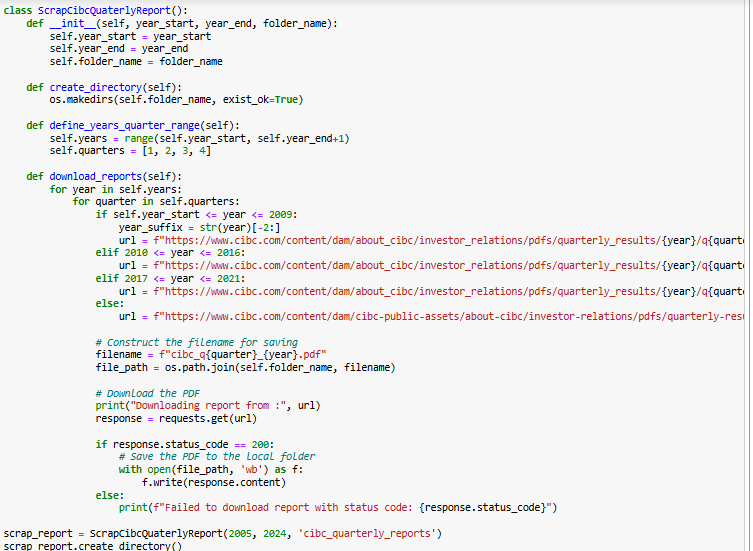
The ScrapCibcQuaterlyReport class was implemented to automate the extraction of CIBC’s quarterly financial reports from 2005 to 2024. The script first creates a directory to store the downloaded reports and defines the range of years and quarters to be retrieved. Based on the year, it dynamically constructs the appropriate URL pattern to fetch the reports from CIBC’s investor relations website. Using the requests library, each report is downloaded and saved locally in PDF format.
Text Extraction from Reports
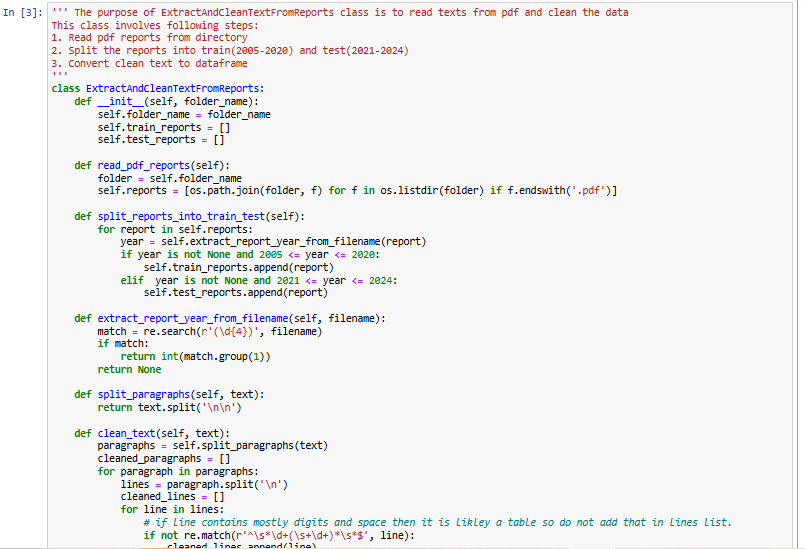
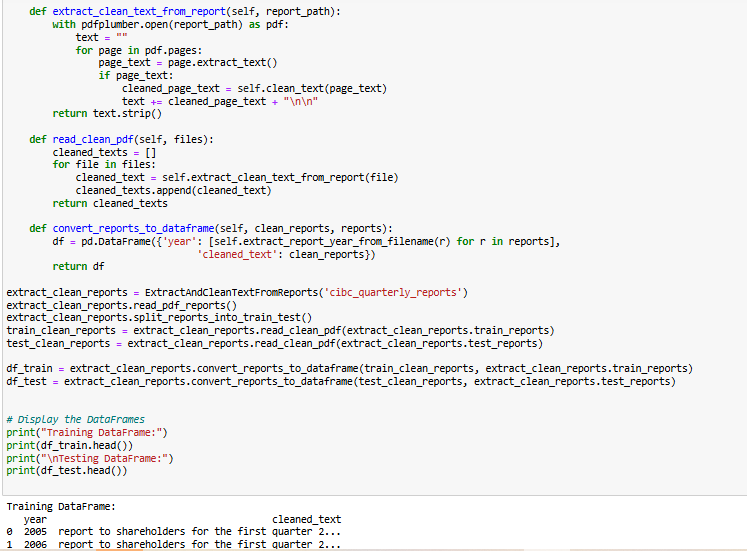
The ExtractAndCleanTextFromReports class was designed to automate the extraction and cleaning of text from CIBC’s quarterly financial reports. The process begins by reading all PDF reports stored in the directory and categorizing them into training (2005–2020) and testing (2021–2024) datasets based on their filenames. Each report’s text is extracted using the pdfplumber library, ensuring that only relevant textual information is retained while filtering out numerical tables.
To enhance readability and usability, the extracted text undergoes several preprocessing steps. Paragraphs are identified and split based on newline characters, and further cleaning is performed by removing special characters, extra spaces, and unwanted numerical values. The cleaned text is then structured into a Pandas DataFrame, where each row represents a financial report with its corresponding year. This structured dataset serves as the foundation for further analysis and model training.
Rule Based Learning
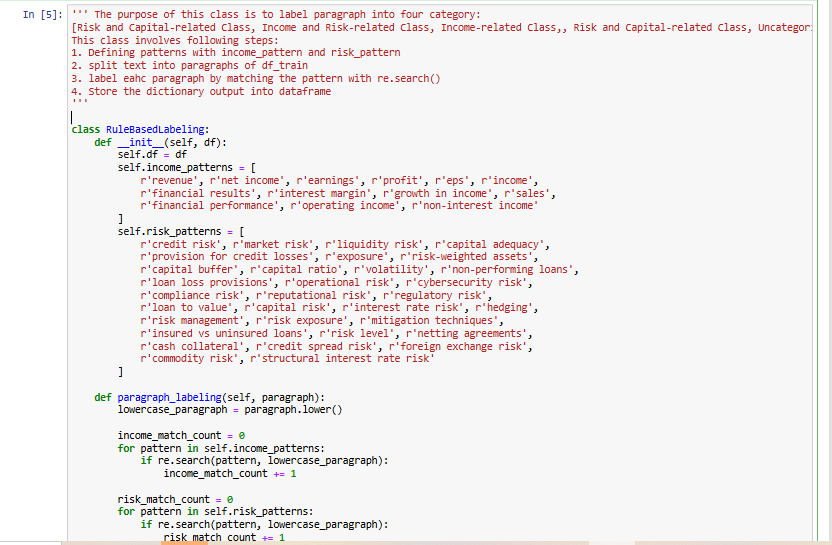
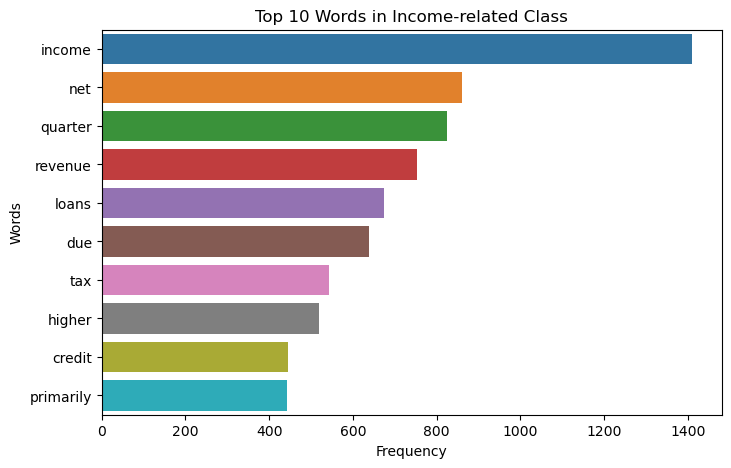
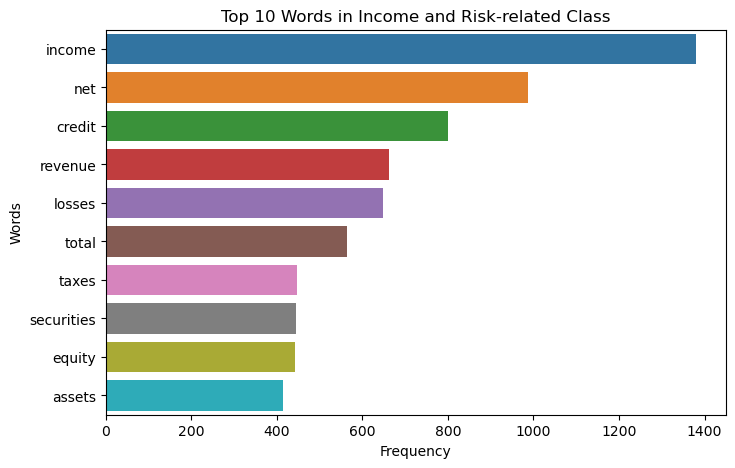
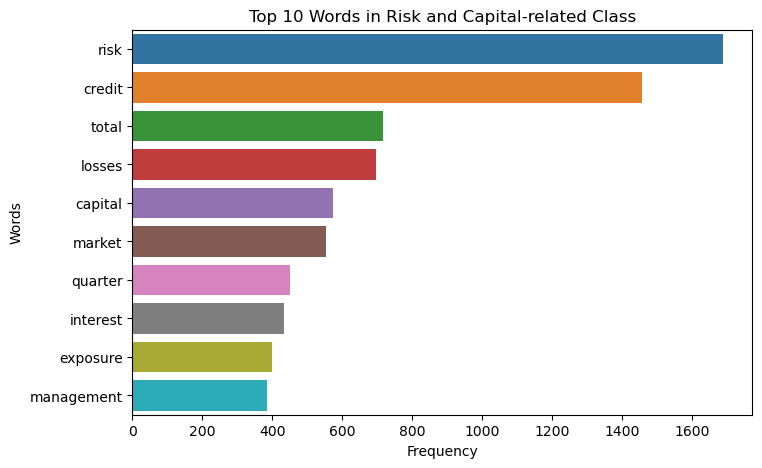
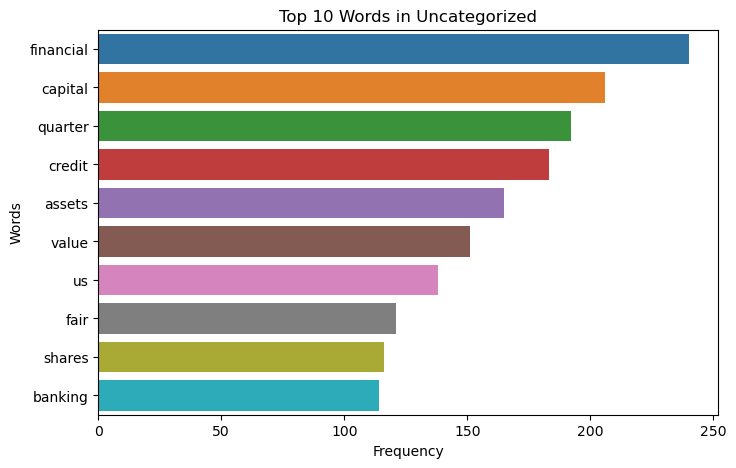
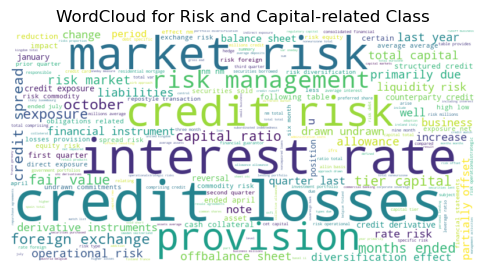
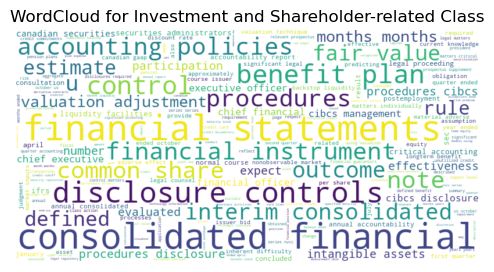
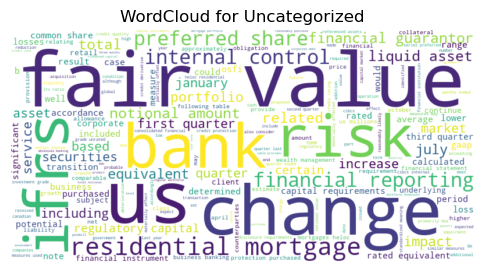
To categorize financial report paragraphs into meaningful classes, a Rule-Based Labeling approach was implemented. This method assigns each paragraph to one of four categories: Income-related Class, Risk and Capital-related Class, Income and Risk-related Class, or Uncategorized based on predefined keyword patterns.
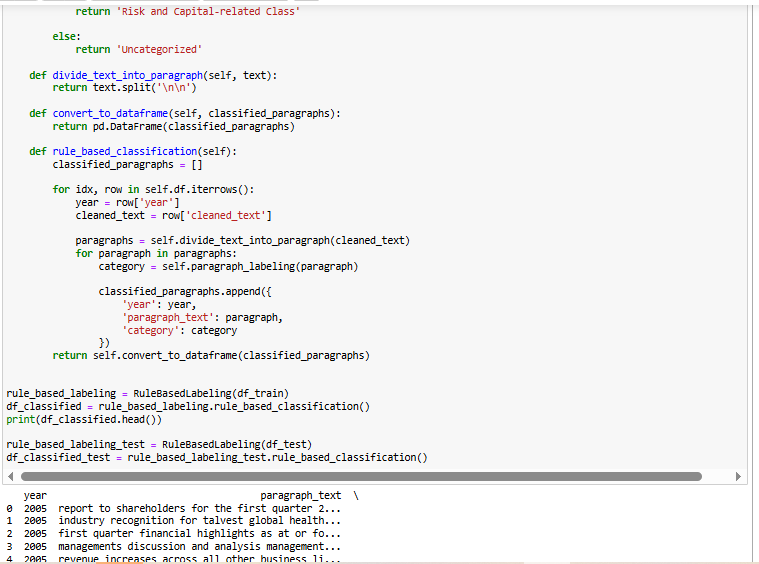
The process begins by defining two sets of patterns—income-related and risk-related—which include key financial terms such as “revenue,” “net income,” “credit risk,” and “capital adequacy.” Each paragraph from the cleaned financial reports is examined, and regular expressions (re.search) are used to check for matches with these patterns. If a paragraph contains both income and risk-related terms, it is categorized based on the dominant pattern match. If it contains only one type, it is labeled accordingly, while paragraphs with no matches remain Uncategorized.
This structured classification allows for efficient identification of key financial insights within the reports. The labeled paragraphs are stored in a DataFrame, providing a structured dataset for further analysis or model training.
Lemmatization and Stop Word Removal
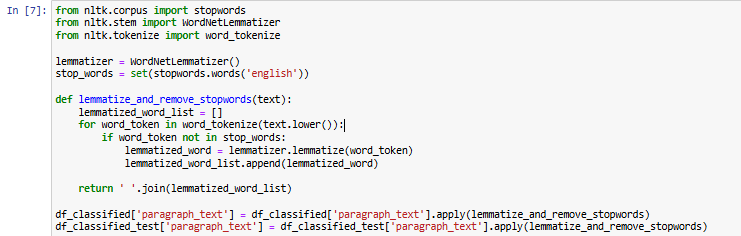
Lemmatization reduces words to their base or root form, ensuring consistency in textual data by converting words like running to run or better to good. Stop word removal eliminates commonly used words such as the, is, and and, which do not contribute meaningful insights.
The code performs lemmatization and stop word removal on the paragraph_text column of the classified dataset using NLTK (Natural Language Toolkit). A WordNetLemmatizer object is initialized to reduce words to their base form, and the list of English stop words is loaded using stopwords.words('english'). The preprocessing function, lemmatize_and_remove_stopwords(text), first converts the input text to lowercase for consistency, then tokenizes it into individual words. Each word is checked against the stop word list, and if it is not a stop word, it undergoes lemmatization. The cleaned words are rejoined into a string and returned. This function is applied to the paragraph_text column in both df_classified (training data) and df_classified_test (test data), ensuring that all paragraphs undergo lemmatization and stop word removal before further processing. By implementing this step, the dataset becomes more structured and noise-free, enhancing text classification, sentiment analysis, and financial insight extraction.
Classification Models with TFIDF
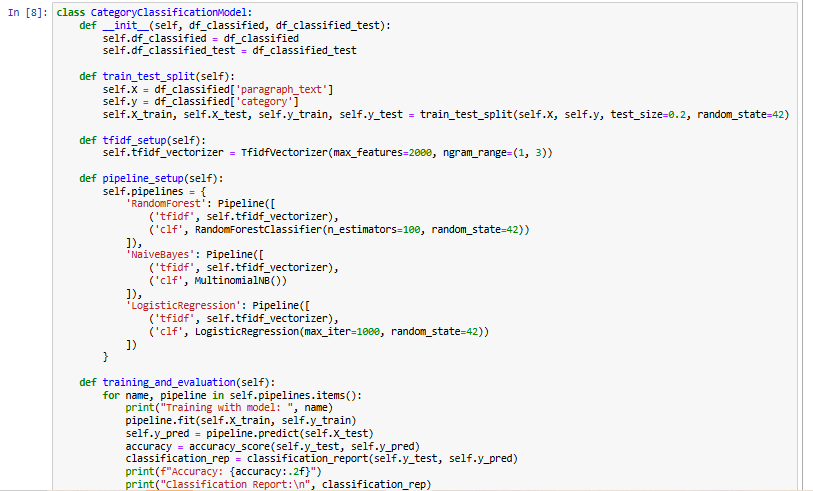
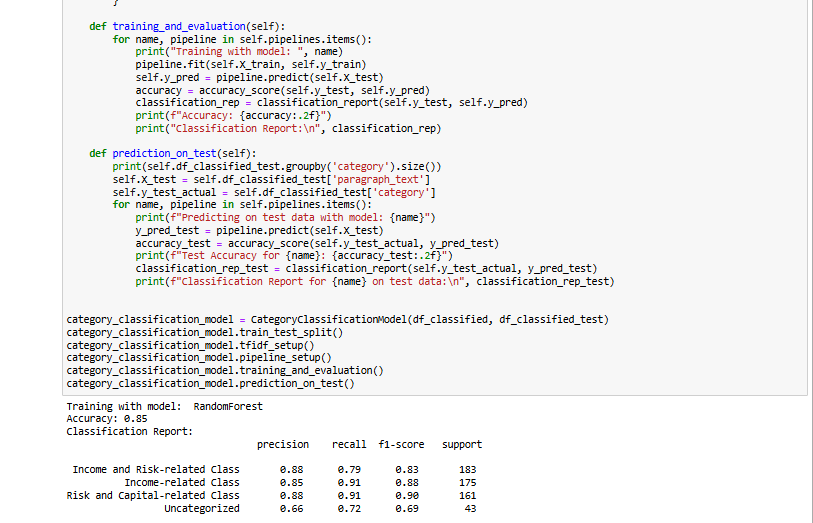
This section focuses on text classification using TF-IDF (Term Frequency-Inverse Document Frequency) for feature extraction and multiple machine learning models. The CategoryClassificationModel class is designed to preprocess the dataset, train classifiers, and evaluate their performance.
In pipeline_setup, three machine learning pipelines are created using Random Forest, Naïve Bayes, and Logistic Regression. Each pipeline consists of a TF-IDF vectorizer followed by a classifier. The training_and_evaluation method trains these models on the training set and evaluates them using accuracy scores and classification reports.
The model takes two datasets as input: df_classified (training data) and df_classified_test (test data). The train_test_split method separates the training data into features and labels, then splits it into training and validation sets. The tfidf_setup method initializes a TF-IDF vectorizer, converting text into numerical features for better representation.
The prediction_on_test method applies the trained models to the test dataset, evaluating their performance on unseen data. Finally, an instance of CategoryClassificationModel is created, and all methods are executed in sequence, ensuring a structured workflow for text preprocessing, model training, evaluation, and prediction. This approach improves text classification, making it useful for sentiment analysis, topic categorization, and financial text classification.
Training Results with RandomForest
Accuracy: 0.97
Metric
Income and Risk-related Class
Income-related Class
Investment and Shareholder-related Class
Risk and Capital-related Class
Uncategorized
Overall Accuracy
Precision
0.98
0.96
0.97
0.98
0.96
0.97
Recall
0.94
0.99
0.93
0.99
0.95
F1-Score
0.96
0.97
0.95
0.98
0.96
Training Results with NaiveBayes
Accuracy: 0.80
Metric
Income and Risk-related Class
Income-related Class
Investment and Shareholder-related Class
Risk and Capital-related Class
Uncategorized
Overall Accuracy
Precision
0.82
0.78
0.85
0.84
0.73
0.80
Recall
0.66
0.92
0.69
0.85
0.69
F1-Score
0.73
0.84
0.76
0.84
0.71
Training Results with LogisticRegression
Accuracy: 0.92
Metric
Income and Risk-related Class
Income-related Class
Investment and Shareholder-related Class
Risk and Capital-related Class
Uncategorized
Overall Accuracy
Precision
0.93
0.92
0.98
0.94
0.88
0.92
Recall
0.88
0.98
0.85
0.94
0.88
F1-Score
0.90
0.95
0.91
0.94
0.88
Category Distribution
Category
Count
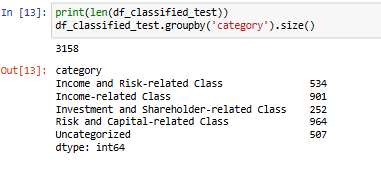
Income and Risk-related Class
534
Income-related Class
901
Investment and Shareholder-related Class
252
Risk and Capital-related Class
964
Uncategorized
507
Random Forest performed best with 85% validation accuracy and 86% test accuracy, showing strong precision across most categories but weaker on Uncategorized data. Logistic Regression followed with 78% and 81% accuracy, balancing performance but struggling with Income-related and Uncategorized classes. Naïve Bayes had the lowest accuracy (69% and 76%), indicating it may not be ideal for this dataset. Random Forest is the best choice, while Logistic Regression remains a viable alternative for efficiency.
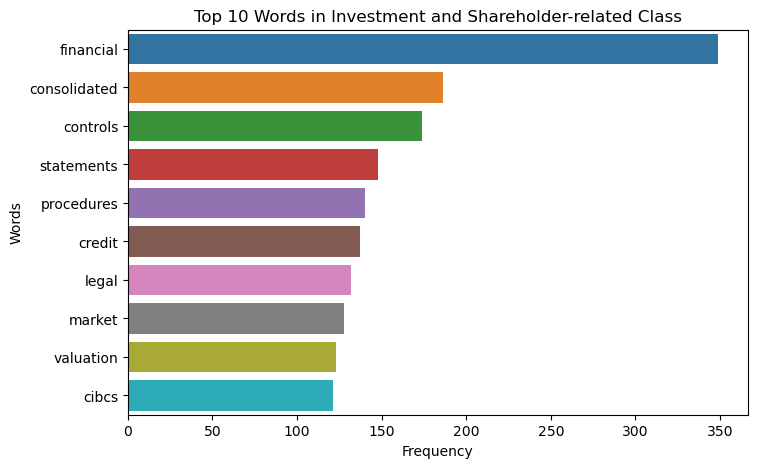
Visualizing TFIDF Results
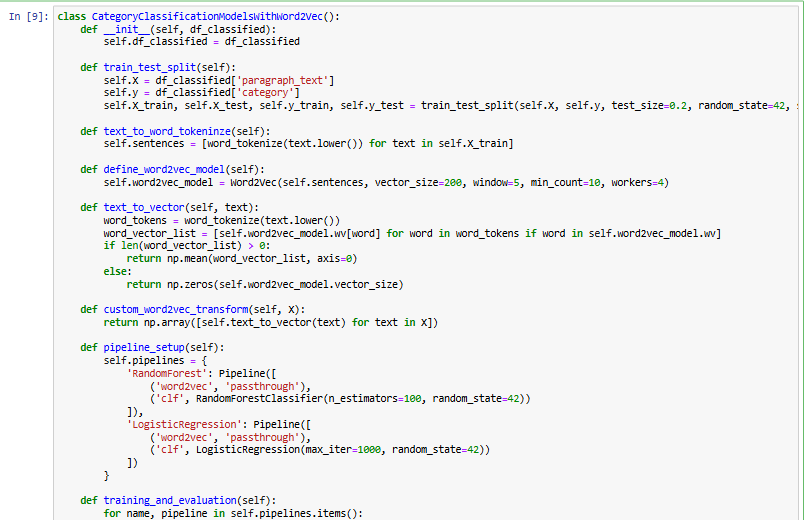
Fine Tuning with Word2Vec
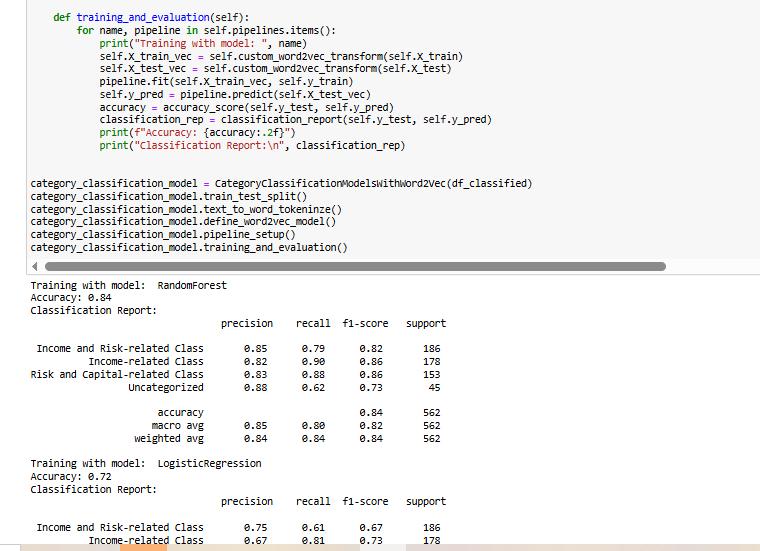
This implementation applies Word2Vec embeddings for text classification. The CategoryClassificationModelsWithWord2Vec class processes df_classified to train machine learning models using word embeddings instead of traditional TF-IDF features.
The train_test_split method splits the dataset into training and test sets. Text is then tokenized using word_tokenize, and a Word2Vec model is trained to generate word embeddings. The text_to_vector function converts each paragraph into a vector by averaging the embeddings of its words.
A pipeline is set up with Random Forest and Logistic Regression classifiers. Since the text is already transformed into vectors, the word2vec step is marked as 'passthrough'. During training, the models use the transformed text representations, and their performance is evaluated using accuracy and classification reports.
Training Results with RandomForest
Accuracy: 0.91
Metric
Income and Risk-related Class
Income-related Class
Investment and Shareholder-related Class
Risk and Capital-related Class
Uncategorized
Overall Accuracy
Precision
0.93
0.91
0.92
0.92
0.90
0.91
Recall
0.88
0.96
0.89
0.94
0.83
F1-Score
0.90
0.93
0.90
0.93
0.86
Training Results with LogisticRegression
Accuracy: 0.66
Metric
Income and Risk-related Class
Income-related Class
Investment and Shareholder-related Class
Risk and Capital-related Class
Uncategorized
Overall Accuracy
Precision
0.69
0.71
0.64
0.65
0.52
0.66
Recall
0.40
0.83
0.48
0.75
0.52
F1-Score
0.51
0.76
0.55
0.70
0.52
Testing Results with RandomForest
Test Accuracy: 0.71
Metric
Income and Risk-related Class
Income-related Class
Investment and Shareholder-related Class
Risk and Capital-related Class
Uncategorized
Overall Accuracy
Precision
0.77
0.76
0.65
0.75
0.57
0.71
Recall
0.56
0.81
0.38
0.77
0.75
F1-Score
0.65
0.79
0.48
0.76
0.64
Testing Results with LogisticRegression
Test Accuracy: 0.63
Metric
Income and Risk-related Class
Income-related Class
Investment and Shareholder-related Class
Risk and Capital-related Class
Uncategorized
Overall Accuracy
Precision
0.66
0.62
0.37
0.75
0.50
0.63
Recall
0.36
0.80
0.28
0.77
0.53
F1-Score
0.46
0.70
0.32
0.76
0.51
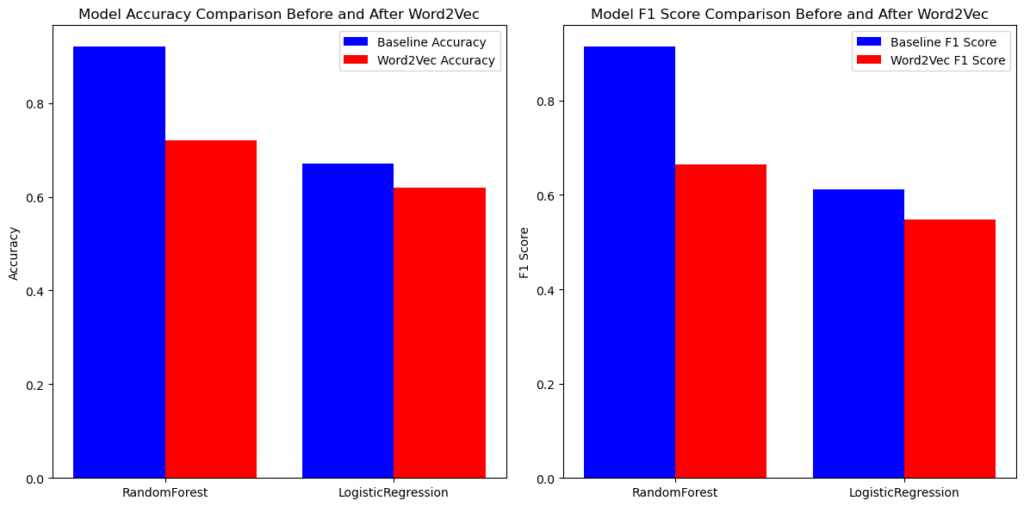
Visualizing Word2Vec Results
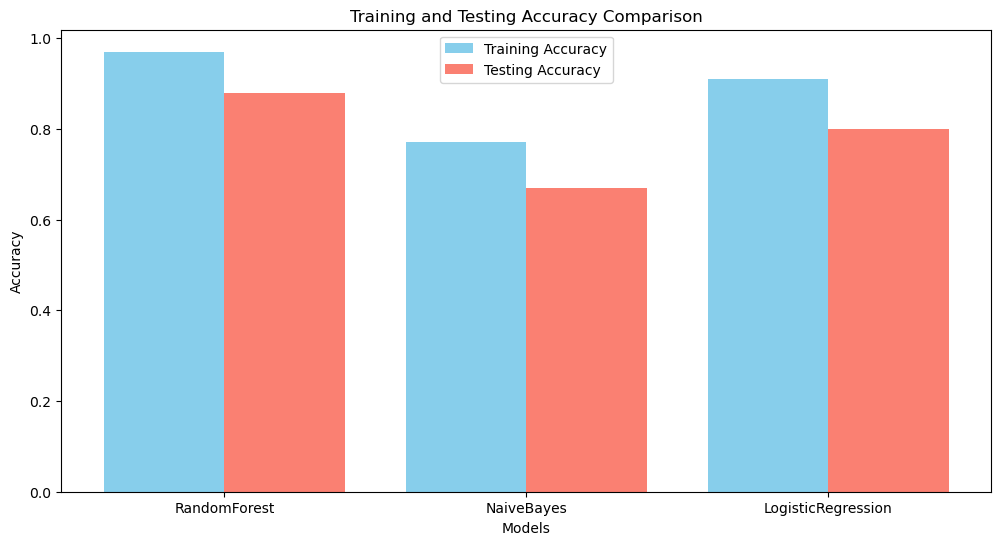
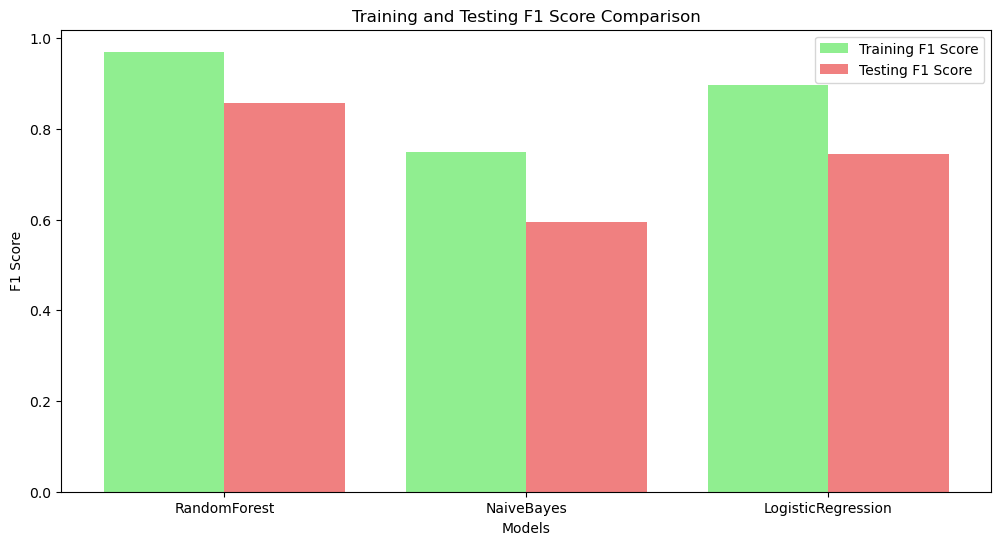
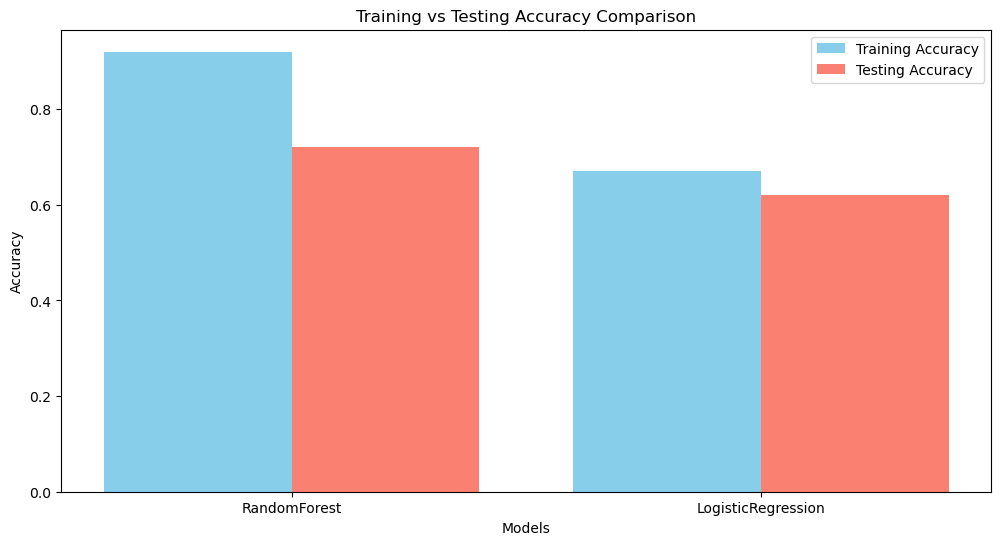
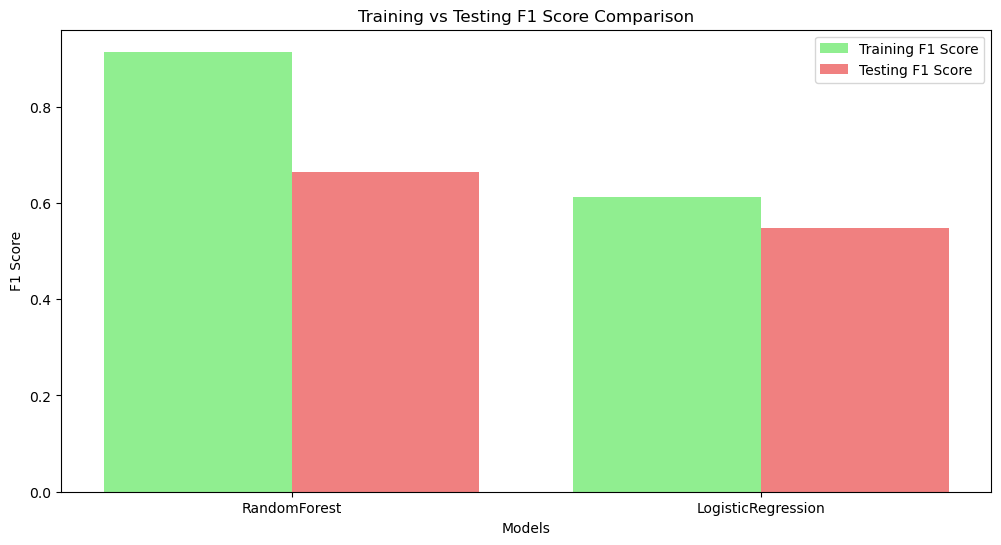
Model Accuracy Comparison before and after Word2Vec
The results show that applying Word2Vec embeddings negatively impacted both accuracy and F1 scores for the RandomForest and LogisticRegression models. Before Word2Vec, RandomForest performed significantly better, but its performance dropped after using embeddings. Similarly, LogisticRegression also experienced a decline. This suggests that Word2Vec may not have effectively captured the necessary features for classification, possibly due to suboptimal embeddings or a mismatch between the dataset and the word representations.
Data Visualization
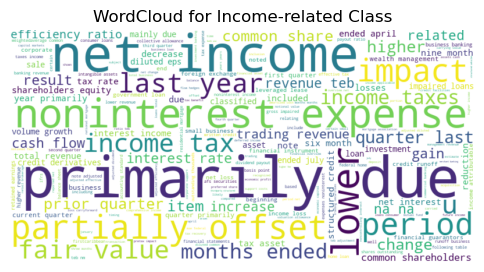
Top 10 Words in Income Related Class
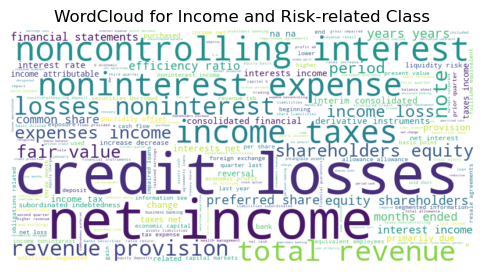
WordCloud
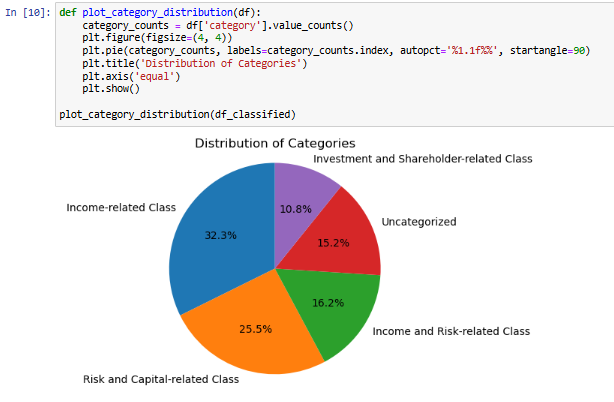
Distribution of Categories - Pie chart
Majority of our data is from the Income related class and Risk and Capital related class. This piechart helps us get a good understanding in the distribution among our categories.
On the right we can see the exact count of each of the categories.
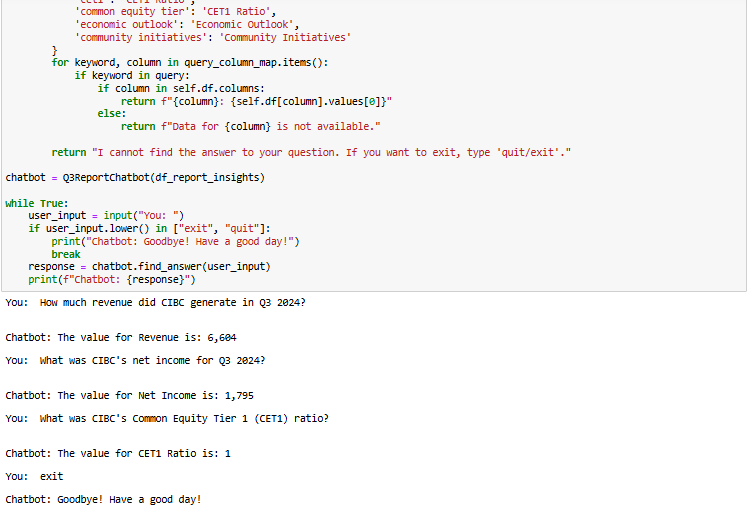
Chatbot
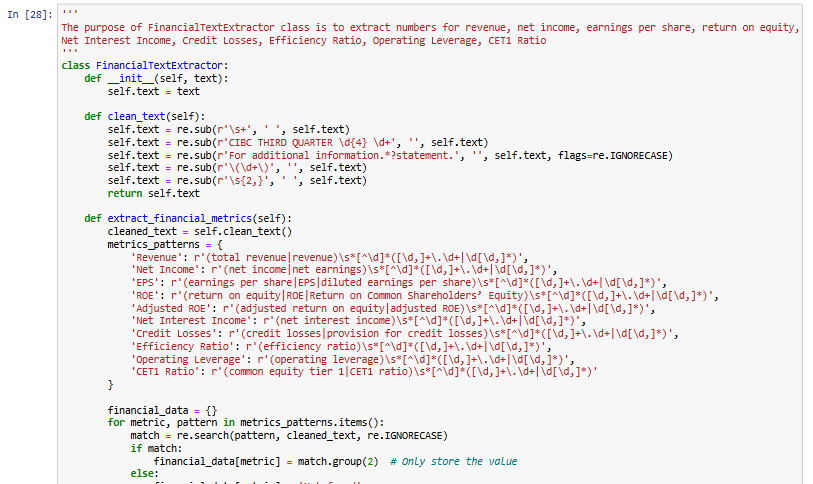
Clean Text and Extract Patterns
The FinancialTextExtractor class is designed to extract key financial metrics from textual reports. It first cleans the text by removing unwanted characters, whitespace, and irrelevant sections. Then, it applies regex patterns to identify and extract numerical values for various financial indicators such as Revenue, Net Income, Earnings Per Share (EPS), Return on Equity (ROE), Adjusted ROE, Net Interest Income, Credit Losses, Efficiency Ratio, Operating Leverage, and CET1 Ratio. The extracted data is then structured into a pandas DataFrame for easy analysis. This approach helps automate financial data extraction from unstructured text, making it useful for financial analysis and reporting.
Result
The final results of the project indicate that TF-IDF was the most effective feature extraction method, consistently outperforming Word2Vec in financial text classification. Random Forest emerged as the best-performing model, achieving 97% accuracy with TF-IDF, compared to 91% with Word2Vec. Logistic Regression also performed well with TF-IDF (92% accuracy) but struggled with Word2Vec, dropping to 66% accuracy. On test data, Random Forest with TF-IDF achieved 88% accuracy, whereas it dropped to 71% with Word2Vec. Similarly, Logistic Regression’s accuracy fell from 79% (TF-IDF) to 63% (Word2Vec). These results highlight that Word2Vec embeddings did not enhance model performance and instead reduced classification effectiveness, likely due to limitations in capturing financial text nuances. Random Forest with TF-IDF remains the best approach for classifying CIBC quarterly financial reports, providing the highest accuracy, precision, and F1 scores across all financial categories.
Description
This project focuses on automating the classification of CIBC quarterly financial reports using Natural Language Processing (NLP) and machine learning models. Financial text is categorized into predefined classes using TF-IDF and Word2Vec embeddings for feature extraction. Three classification models—Random Forest, Logistic Regression, and Naïve Bayes—are evaluated for performance. Random Forest with TF-IDF achieved the highest accuracy (97%), while Word2Vec negatively impacted performance. Additionally, a rule-based chatbot was developed to retrieve financial insights from reports. The project demonstrates the effectiveness of TF-IDF over Word2Vec for financial text classification and highlights Random Forest as the best-performing model.